 This year the Pentaho Community Meeting 2014 (pcm14) was in Antwerpen and started with a (short) hackathon. Some company groups were formed. Together with Peter Fabricius I joined the people from Cipal (or they joined us). We did not get an assignment so we have to come up with something nice ourselves. Our first thought was to do ‘something’ with Philae (the lander who just started sending information form the comet “Churyumov-Gerasimenko“). We searched for some data, but we could not find anything useful.
So we decided to take a subject closer to home and wondered if we could map the locations of the PCM14 participants. We already had a kettle transformation to get the location data from Facebook pages(city, country), parse it to a geocoding service to get the latitude and longitude and save it to a gpx file. It was based on some work Peter did for German rally teams to the Orient. We ‘only’ need to adjust it to our needs and we need data to request the Facebook company page of the participants.
From Bart we got a list of the email addresses of the participants (it has advantages that you are part of a semi Belgium team and one of the team members was actually working on Bart his machine ;-)). We were able to grap the domain name without country code using Libre Office (sorry we only had an hour to code) and tried to feed it to the Facebook Graph API. It is basically just a http client step to get the info from eg http://graph.facebook.com/pentaho. This results in the company page in a nice json format (Unfortunately(?) the Graph API does not return the location for normal ‘users’ with this method). One request broke the kettle transformation (some strange error), so we removed that organization.
Facebook returned the country name, but the geocoding tool needed the 2-character country code. Because Peter had only German teams, he just added GE, but of course this was not an option for us. Fortunately we had a databases with the country-isocode translation. So we could feed the geocoding service with the right data and this also returns some nice json.
After about 37 requests we got an error: no content is allowed before the prolog (or something like that). Damn we reach some rate limiting…. So we need delayed each request a second to get all the results. The first run we did not get all the results. Why? we don’t know…
In the mean time Peter and ‘uh I forgot his name’ were busy trying to get the bi-server installed and prepare a dashboard with a map, which should read a kettle transformation step and plotting the participants. They had also some issues, but……
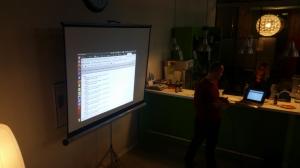
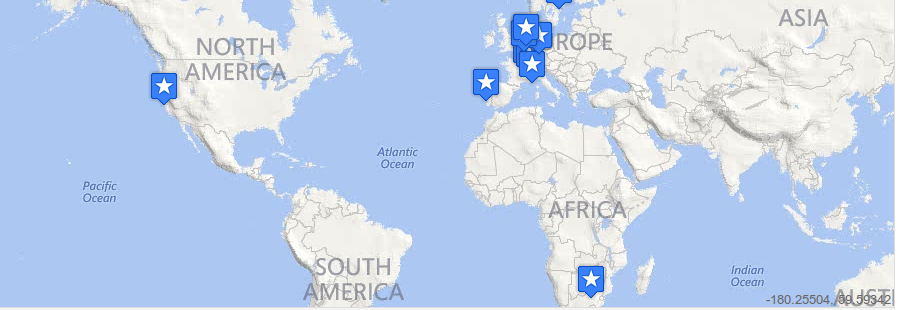
It was time for the presentations…. At that point we did not have anything to show…. No results of the kettle transformation, no map….. During the setup of one of the presentations I run the kettle transformations again and hooray I get a GPX file. It contains 9 locations of the participants (we had about 55 different companies in our list). Since we did not have the map ready, we could not present it using the bi-server. But also in this case ‘Google was our friend’. Uploading it to Google drive, using preview content (using My GPX Reader (it took some clicks) we were able to show it to the public.
On my way to podium I noticed Facebook also returns the latitude and longitude. So we did not need to use the detour via the geocoding service 🙁

After al presentations were made, the jury discussed the products and presentations and we won!!! (as did all the other teams). We got some nice raspberry PI B+. In case you don’t know what it is: Basically it is a hand sized desktop computer with no case and a lot of connectors…
Thanks Bart and Matt for organizing this hackathon!!!
Edit: By request I added a sample input file. I also changed it to read csv: facebook_locations
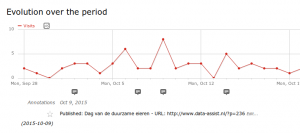
 statistics (see graph).


