Auto machine learning

Auto machine learning at PCM17

Last weekend I was at the tenth Pentaho Community Meeting (PCM) in Mainz. It is always a meeting with lots of fun, but also lots of interesting talks and discussion. One of the talk during the last PCM was by Caio Moreno de Souza about Auto machine learning (or autoML). Very simple explained: with machine learning, you give the computer data and it creates and validate a model, so you can predict the ‘future’.

His presentation and discussing about it during PCM17 got my brains spinning at large speed. (As you might now my background is a nice combination of statistics (human science), programming, but rather new when it comes to machine learning).

Auto machine learning processThe data versus business gap

At this moment I think autoML in the sense like above model is not going to work. I think we need some information to determine which algorithm(s) (and parameters to feed these algorithms) to use. But I think autoML or maybe we should call it easyML is needed to fill some gap:

On one side, we have the data guys: very good in manipulation data, actually should have a very basic understanding about statistics (at least measurement level), but are often missing or ignoring this background.

On the other side we have the business guys: they have ‘domain information’, they know a lot about the subject, preferably have some understanding of the data, but especially how it is linked to the subject. They also have at most some basic understanding about statistics.

In between you have the machine learning tools. Even if they are easy to use (like the black box above (hmm autoweka seems to implement this black box)), which is able to select the ‘best’ algorithm), we still have a gap.

The machine learning gap

With a little bit of training/documentation you might be able to let the data guys perform the analysis and to some extend interpret the results. And the business guys should be able to face validate the resulting model. But both of them don’t know which algorithms to choose. You should have some statistical/methodological understanding to choose the proper algorithms. You can not use all algorithms for each problem. Trend analysis needs other algorithms than classification analysis. But maybe more important for some (classification) problems (eg recurrent cancer) you rather not miss recurrence, but if you classify non recurrence as recurrence is not as bad. In this case (eg recurrence of breast cancer): the recall on recurrence event should be high.

The solution

I think it is not desirable/needed to train one of these sides to be able to pick the appropriate algorithms and select the correct parameters. But I think we should be able to create more awareness about the different kinds of machine learning problems and the outcome you wish to optimize, so you can provide information to the black box to create methodological valid and for the business interesting models. But of course the black box should be able to use this information in the model selection. Maybe with Autoweka this is possible, but that I need to investigate

I’m looking forward to help close the machine learning gap and with that the gap between the business guys and the data guys.
PDI python executor

One of my clients has a python script to validate incoming data files. One important feature is to test the HashCode of the file, to investigate if it is a legitimate file. Of course it would be possible to convert the python script to a Pentaho pdi transformation, but why not use the existing script.

Installation

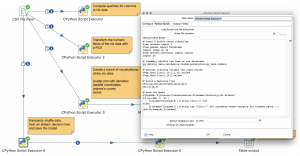
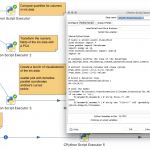
pdi python executorPDI has a plugin called Cpython Script executor, which is developed in the pentaho labs. It is installable via the Marketplace. But unfortunately it did not mention the requirements to execute a python script. Luckily it was on the documentation provided within the github repository. It needs Pandas and Sklearn. Knowing a little bit about python I tried to install it using pip. But on my Ubuntu laptop that did not work. I did not manage to install sklearn. So a little browsing brought me to http://scikit-learn.org/stable/install.html with the suggestion to install Sklearn using the Linux repositories. So I did (and removed the pipped install pandas and install it from the linux repo). After that I was able to run the sample pdi transformations provided by Mark Hall.

First results

The cpython script executor is targeted to data scientists. And I guess it is of great value to manipulate big datasets or complex calculations. However for my purpose it seems rather slow. I tried a simple transformation which reads 10 rows with one variable containing the value ‘pietje’. The python script check if the value was ‘pietje’. If so, it returns 1, else 0. It takes about 6 seconds to complete. So a more difficult script with more data probably needs a different approach.

Dashboard watergebruik

Reliable water access with Susteq

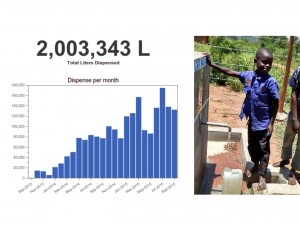
Susteq, een van mijn klanten, maakt betalingssystemen voor watertappunten in Kenia (en binnenkort Tanzania). Door het water letterlijk betaalbaar te maken, is er geld beschikbaar om het punt te onderhouden en dus in gebruik te houden. Bijkomend voordeel is dat er ook gemonitord wordt hoeveel water er getapt wordt en door hoeveel mensen. De afgelopen tijd ben ik bezig geweest om deze data om te zetten met behulp van Pentaho en in een dashboard weer te geven, zodat bekeken kan worden welke waterpunten goed werken. Vlak voor de oplevering is er toevallig een mijlpaal gehaald bij hun pilotproject. In totaal was er 2.000.000 liter water getapt. Dat klinkt naar een enorme hoeveelheid water en de mensen hebben ondertussen al twee jaar betrouwbaar drinkwater. Maar hoe lang zouden wij, in Nederland, daar eigenlijk mee toe kunnen. Volgens een van de grafieken komen er elke maand  ongeveer 100 gebruikers water halen (ongeveer 500 mensen). Volgens de website van Vitens gebruiken wij in Nederland 119 liter per persoon per dag. Een snelle rekensom leert dat we met 500 mensen binnen 33 dagen die 2 miljoen liter water verbruikt hebben……

Wat kunnen wij met de hoeveelheid water die zij per dag per persoon gebruiken

Watergebruik in KeniaIn augustus 2015 is er bijna 138000 liter door 98 unieke gebruikers getapt. Dat is 9 liter per persoon per dag. In werkelijkheid is dit zelfs minder, omdat er ook een paar waterverkopers water halen bij deze tappunten. Er zijn 3 gebruikers die significant meer water tappen dan gemiddeld (>200 liter per dag). Gezien de hoeveelheid water die zij tappen, zouden zij zo’n 150 mensen bedienen. Het gemiddeld gebruik per persoon per dag komt dan op 7 liter, dat is nog geen minuut douchen bij ons… Met zo weinig water zouden we ons watergebruik drastisch moeten aanpassen.

Combine two list of registry agencies (fuzzy match)

The data

iati-logo

The IATI-standard has a codelist of organisation registry agencies (Chamber of Commerces) to create an organisation identifier. The organisation identifier should start with the code of one of these agencies. However the codelist is not complete (yet).


opencorporates

At the opencorporates website it is possible to search companies that are registered via several ‘registry agencies’. To use the information found via opencorporates the original registry agencies should be on the IATI codelist. So we need to get a list of agencies from the opencorporate website that are not known to IATI.

The Problem

On both list we have a (iso 3166) country code and a registry name. The same registry could have a (slightly?) different name on both list. But (about) the same name could exists in multiple countries. So we want to perform a fuzzy match on registry name, taken the country into account. We don’t need to compare the UK Companies House with the Companies House of Gibraltar.

In Pentaho Data-Integration is a fuzzy match step available to match two datasets using one field with different search algorithms. Unfortunately it is not possible to add another field to restrain the possible matches.

The solution

pdi fuzzy match

Instead of a one step approach we need three steps:

  1. merge the datasets based on the countrycode
  2. calculate the (levenshtein) distance
  3. determin the best/correct matches

In this case this method was sufficient. We only had a few registries in each country. But with other datasets this method is not optimal. I hope somebody will extent the Pdi fuzzy match step. A jira case is already filed.


Pentaho Community Meeting 2014: Hackathon

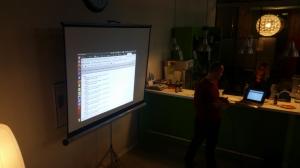
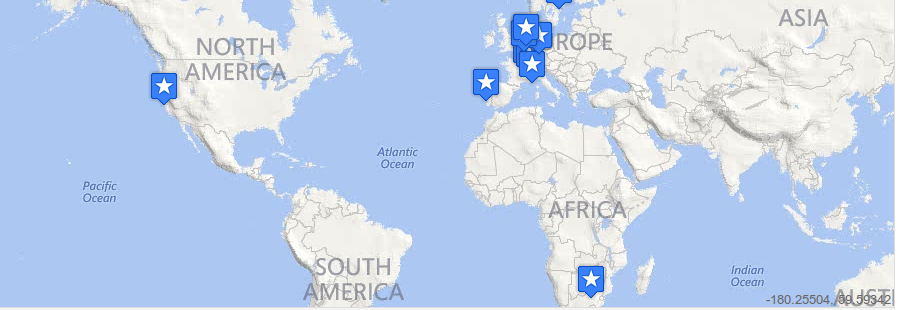
Presenting our results at PCM14 (gpx output on screen)This year the Pentaho Community Meeting 2014 (pcm14) was in Antwerpen and started with a (short) hackathon. Some company groups were formed. Together with Peter Fabricius I joined the people from Cipal (or they joined us). We did not get an assignment so we have to come up with something nice ourselves. Our first thought was to do ‘something’ with Philae (the lander who just started sending information form the comet “Churyumov-Gerasimenko“). We searched for some data, but we could not find anything useful.

So we decided to take a subject closer to home and wondered if we could map the locations of the PCM14 participants. We already had a kettle transformation to get the location data from Facebook pages(city, country), parse it to a geocoding service to get the latitude and longitude and save it to a gpx file. It was based on some work Peter did for German rally teams to the Orient. We ‘only’ need to adjust it to our needs and we need data to request the Facebook company page of the participants.

From Bart we got a list of the email addresses of the participants (it has advantages that you are part of a semi Belgium team and one of the team members was actually working on Bart his machine ;-)). We were able to grap the domain name without country code using Libre Office (sorry we only had an hour to code) and tried to feed it to the Facebook Graph API. It is basically just a http client step to get the info from eg http://graph.facebook.com/pentaho. This results in the company page in a nice json format (Unfortunately(?) the Graph API does not return the location for normal ‘users’ with this method). One request broke the kettle transformation (some strange error), so we removed that organization.

Facebook returned the country name, but the geocoding tool needed the 2-character country code. Because Peter had only German teams, he just added GE, but of course this was not an option for us. Fortunately we had a databases with the country-isocode translation. So we could feed the geocoding service with the right data and this also returns some nice json.
After about 37 requests we got an error: no content is allowed before the prolog (or something like that). Damn we reach some rate limiting….  So we need delayed each request a second to get all the results. The first run we did not get all the results. Why? we don’t know…

In the mean time Peter and ‘uh I forgot his name’ were busy trying to get the bi-server installed and prepare a dashboard with a map, which should read a kettle transformation step and plotting the participants. They had also some issues, but……

It was time for the presentations…. At that point we did not have anything to show…. No results of the kettle transformation, no map….. During the setup of one of the presentations I run the kettle transformations again and hooray I get a GPX file. It contains 9 locations of the participants (we had about 55 different companies in our list). Since we did not have the map ready, we could not present it using the bi-server. But also in this case ‘Google was our friend’. Uploading it to Google drive, using preview content (using My GPX Reader (it took some clicks) we were able to show it to the public.

On my way to podium I noticed Facebook also returns the latitude and longitude. So we did not need to use the detour via the geocoding service 🙁

pcm14-hackathon-map

After al presentations were made, the jury discussed the products and presentations and we won!!! (as did all the other teams). We got some nice raspberry PI B+. In case you don’t know what it is: Basically it is a hand sized desktop computer with no case and a lot of connectors…

Thanks Bart and Matt for organizing this hackathon!!!

Edit: By request I added a sample input file. I also changed it to read csv: facebook_locations