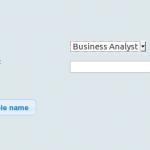
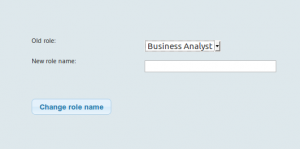
Screenshot: Change Role Name plug-in

Change Role Name plug-in for Pentaho

The current Pentaho BI server (CE 5.4/6.1)  has no option to change the role name. So if you want to change the role name you have to add a new role, add permissions and users to the new role and delete the old role. This is error prone. Using the rest API of the BA-server I’ve created a Sparkl plug-in to easily rename the role name.

Features:Screenshot: Change Role Name plug-in

  • drop down with existing role to select
  • check if source or destination role is missing
  • check if destination role exists (not case sensitive)
  • add permissions and users to new role

Limitation

Because of the duplication check it is not possible to change the cases of a role in a single step. First you need to rename the role to some dummy name. Then you can rename this dummy role to the desired role name with the correct capitals.

The plugin is created using Pentaho BA 5.4 CE, but should work on 6.1 as well.

Installation

The plugin needs admin access to the bi-server. Add the variables P_LOGIN and P_PASSWORD with the credentials of an useraccount with admin rights to ~/.kettle/kettle.properties. The biserver will automatically access this file.

Download

Download the plug-in: changerolename.zip

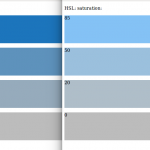
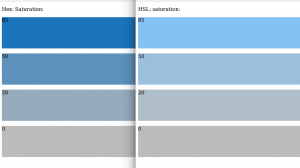
Kleurenrange in hex en hsl equivalent

Kleurenrange bepalen

Het probleem

Voor een staafdiagram met meerdere (3 of 4) series wilde ik een kleurenranKleurenrange in hex en hsl equivalentge samenstellen, gebaseerd op een kleur. Via http://htmlcolorcodes.com/color-picker/ kon ik op basis van de hoofdkleur wel een kleurenrange maken, maar het nadeel was dat ik daarmee 8 kleuren kreeg en dat ze daardoor niet onderscheidend genoeg waren. Het simpelweg overslaan van telkens een kleur, leverde niet het gewenste resultaat op.

De oplossing

De intensiteit van een kleur kan makkelijk aangepast worden met behulp van het hsl-kleurenschema. Dit bestaat uit de ‘hue’ (zeg maar de kleur), de ‘saturation’ (de hoeveelheid van die kleur) en de ‘light’ (helderheid). Door de satuaration aan te passen, kan je een ‘lichtere’ variant van de kleur krijgen. De hoofdkleur had een saturatie van 85%. Na veel proberen lijkt een verdeling van de satuaratie 85, 50, 20, 0 het meest onderscheidend te zijn. Nu zou css met hsl kleurcodering moeten kunnen werken (en waarschijnlijk de pentaho charts ook). Maar een eenvoudig testje laat zien, dat in ieder geval bij firefox, de hsl kleurdefinitie veel lichter is dan de hex-equivalent, zoals ik die bepaald heb met een grafisch programma. Ik ben wel benieuwd waar een grafisch ontwerper mee zou komen.

Table component with improvements

Weekly statistics with Pentaho Dashboard

A sortable table component with weekly statistics sounds quite easy. However….

Information need

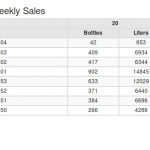
A customer of Susteq wants to sell water jerry cans of 1, 5 and 20 liters. They like to know the weekly sales for each of this jerry cans (number of jerry cans and total amount of water). A table component would be a good instrument to visualize this data, with the sales of the past X weeks.

Problems

  1. To be able to sort the data per week, the datum should have Weekly statistics table without improvementsa format like 2016-08. But the Mondrian query could not return this, because of the use of currentDateMember and the Visual Basic formatting only implements week number without leading zero.
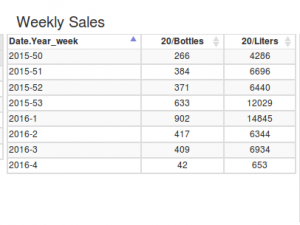
  2. When does week number 1 starts?
  3. In a period (or for certain water sales units) not all different jerry cans are sold, so the number of columns varies so different number of columns
  4. No hierarchy in table header, default row headers look like 1/Bottles, 1/Liters, 5 Bottles, 5 Liters,20/Bottles, 20/Liters

Solution

Database and query (1,2)

In the database/datamodel is a date dimension with two fields containing year and week. Both are of type integer. These are used as level in the hierarchy. We also have an string column year-week with leading zero. We use this field as ordinalColumn at the week level (unfortunately we could not use this field as caption column to display to the user, since it is not implemented yet in cde. To fill the database we used the ISO8601 calculation of week and YEAR. Thanks to Diethard, we could know query the data with something like:

SELECT NON EMPTY CrossJoin([~COLUMNS], {[Measures].[Bottles], [Measures].[Liters]}) ON COLUMNS,
NON EMPTY LastPeriods(${param_period},     CurrentDateMember([Date], ‘${param_date}’))
ON ROWS
With $param_date: [“Date.Year_week”]\.[yyyy]\.[ww]

Adjusting week number string (2)

To add the leading zero we define the type of first column (with the week number) as formattedText and add the leading zero if it has a length of 9 (or less)

  //week number with leading zero
    this.setAddInOptions("colType","formattedText",function(cell_data){
        var tempCell= cell_data.value;
        var tempDate=tempCell.split("-");
        if(tempDate[1] <=9){
            return {  textFormat: function(v, st) { return tempDate[0]+"-0"+tempDate[1]; } };
        }
         else {
            return { textFormat: function(v, st) { return tempDate[0]+"-"+tempdate[1]; }  };
            }  
      });

Different number of table columns (3)

To solve the dynamic number of columns we add some javascript code as pre-execution script as suggested on the pentaho forum:

//reset col headers
    this.chartDefinition.colHeaders = [];
    //this.chartDefinition.colTypes = [];
    this.chartDefinition.colFormats = [];
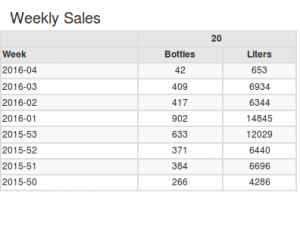
Weekly statistics table with improvementsIt is not necessary to reset the colTypes and we need it for the columnHeaders adjustment. This solution has a disadvantage: when there is no data, it returns an “Error processing component”, caused by this.chartDefinition.colHeaders.  I have not yet found a solution for this problem.

Sub columns/ hierarchy in column headers (4)

Again  based on a post at the Pentaho forum, we add some javascript code as postExecution script to add a table header row which contains the group label (1, 5, 20) and changed the existent header row to remove this group label):

function() {
    var nrcol=2; //number of columns in the group (Bottles and Liters)
    var firstHeader="Week";
    var thpart = "";
    var cells = $( "#" + this.htmlObject + " thead th " );
    cells.each(function(i, v) {
        if( i > 0 ) { //skip the first cell of each row
            var cell = $( v );
            var originalText = cell.text();
            var originalTextParts = originalText.split( "/" );
            if (i%nrcol==0){
                thpart=thpart+"<th class=\"thspan\" colspan='"+nrcol+"'>"+ originalTextParts[0]+"</th>" ; 
            }
            cell.text( originalTextParts[1] ); 
        } else {
            var cell = $( v );
            cell.text(firstHeader);
        } 
    });
     var newHeaderRow = "<tr><th></th>"+thpart+"</tr>";
    $( "#" + this.htmlObject + " thead" ).prepend( newHeaderRow );

    //add some style...
    $( "#" + this.htmlObject + " thead th" ).css( "border", "1px solid #DEDEDE" ).css( "background", "#E6E6E6" );

}
Dashboard watergebruik

Reliable water access with Susteq

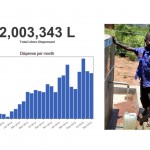
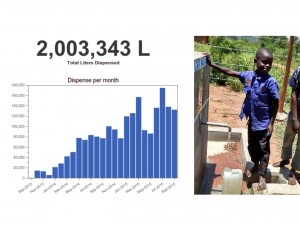
Susteq, een van mijn klanten, maakt betalingssystemen voor watertappunten in Kenia (en binnenkort Tanzania). Door het water letterlijk betaalbaar te maken, is er geld beschikbaar om het punt te onderhouden en dus in gebruik te houden. Bijkomend voordeel is dat er ook gemonitord wordt hoeveel water er getapt wordt en door hoeveel mensen. De afgelopen tijd ben ik bezig geweest om deze data om te zetten met behulp van Pentaho en in een dashboard weer te geven, zodat bekeken kan worden welke waterpunten goed werken. Vlak voor de oplevering is er toevallig een mijlpaal gehaald bij hun pilotproject. In totaal was er 2.000.000 liter water getapt. Dat klinkt naar een enorme hoeveelheid water en de mensen hebben ondertussen al twee jaar betrouwbaar drinkwater. Maar hoe lang zouden wij, in Nederland, daar eigenlijk mee toe kunnen. Volgens een van de grafieken komen er elke maand  ongeveer 100 gebruikers water halen (ongeveer 500 mensen). Volgens de website van Vitens gebruiken wij in Nederland 119 liter per persoon per dag. Een snelle rekensom leert dat we met 500 mensen binnen 33 dagen die 2 miljoen liter water verbruikt hebben……

Wat kunnen wij met de hoeveelheid water die zij per dag per persoon gebruiken

Watergebruik in KeniaIn augustus 2015 is er bijna 138000 liter door 98 unieke gebruikers getapt. Dat is 9 liter per persoon per dag. In werkelijkheid is dit zelfs minder, omdat er ook een paar waterverkopers water halen bij deze tappunten. Er zijn 3 gebruikers die significant meer water tappen dan gemiddeld (>200 liter per dag). Gezien de hoeveelheid water die zij tappen, zouden zij zo’n 150 mensen bedienen. Het gemiddeld gebruik per persoon per dag komt dan op 7 liter, dat is nog geen minuut douchen bij ons… Met zo weinig water zouden we ons watergebruik drastisch moeten aanpassen.